
Volatility is something that every investor has experienced. When markets swing back and forth, it’s not hard to see the turbulence at work — yet the term “volatility” can be somewhat intangible. We know that markets are volatile, but is there a way to define or capture it in an easily understood metric?
Indeed there is such a tool: the Cboe Volatility Index, or VIX as it’s more commonly known. The VIX is a heavily relied upon measure of volatility that investors and asset managers use for reference when dynamically allocating portfolios or trade on directly with options or futures.
Since being introduced in the early 1990s, the VIX has steadily entered the mainstream conversation to the point where many individual retail investors may now be familiar with the term and the general concept of the index.
However, the question remains for many “How does the VIX work?” It’s not an uncommon question; despite the VIX being mentioned regularly by business news shows and financial publications, the inner workings of the VIX can remain a mystery to some.
To help break down misconceptions and ensure you have a better understanding of the VIX, let’s look at how the index works and the top seven things you should know about the VIX.
What is the VIX?
Before we even get into the nitty-gritty of how the VIX works, we need to establish what the index and volatility are exactly. According to Cboe Global Markets, the VIX is:
“[A] calculation designed to produce a measure of constant, 30-day expected volatility of the U.S. stock market, derived from real-time, mid-quote prices of S&P 500 Index (SPXSM) call and put options. On a global basis, it is one of the most recognized measures of volatility — widely reported by financial media and closely followed by a variety of market participants as a daily market indicator.”
Volatility is the “frequency and magnitude of price movements,” whether up or down, that a security such as stocks or options experience over time. The greater the swings in price, the higher volatility is assumed to be.
What does that all mean in more general terms? Essentially, the VIX quantifies in real time the effect that expected price swings have on the underlying security. In this case, options contracts for the S&P 500. Given that the S&P 500 is a broad representation of leading equities across industries, the VIX is relied upon as a measure of implied volatility for the larger stock market as a whole.
Crucially, the VIX is a forward-looking index, measuring implied volatility rather than realized or actual volatility, which are calculated using historical price data. As Cboe puts it: “[T]he VIX Index is intended to provide an instantaneous measure of how much the market expects the S&P 500 Index will fluctuate” in that 30-day timeframe and measures to what degree investors are uncertain about the stock market.
That’s just the tip of the iceberg on what makes the VIX tick. Here are some more insightful bits of information to help you better understand the index:
1 | The VIX is nearly 30 years old
Originally introduced in 1993 by the Chicago Board Options Exchange (now owned by Cboe Global Markets), the VIX had a different methodology at its outset. Initially, it was designed to measure expected 30-day volatility by tracking at-the-money S&P 100 Index (OEX) put and call option prices.
In 2003, Cboe refreshed that methodology with Goldman Sachs, updating the VIX to be based on the S&P 500, as trading volume and value by that time had grown substantially in the derivatives market. The index using the old volatility measure is actually still active but goes by the ticker symbol VXO.
The change was major for the VIX, transforming it from an “abstract concept” into a standard for expressing, trading and hedging market volatility, according to Cboe.
That wasn’t the last enhancement. Introduction of weekly-expiring S&P options (SPX) in 2014 further allowed the VIX to more precisely match moving 30-day targets for expected volatility (we’ll get into these trading products more later). Comparably, standard options contracts expire in 30 days.
2 | A complex mathematical equation is at its core
As one might imagine, calculating volatility is a highly involved and complicated process. At the most basic level, however, the calculation behind the VIX produces an implied volatility reading by aggregating the weighted prices of put and call options (both standard and weekly) with more than 23 days but fewer than 30 days till expiration over a wide range of strike prices.
This is similar to the way other major indices are constructed, such as the S&P 500 or Nasdaq-100, which use the prices of their component stocks to reach an index value. Comparably, the components of the VIX index are options, instead of equities, the prices of which represent expected future volatility.
Functionally, prices used to calculate the VIX are midpoints of real-time SPX option bid and ask-price quotes.
If that’s not enough to satisfy your question of “How does the VIX work?”, take a look at the full mathematical formula that computes the index’s value:
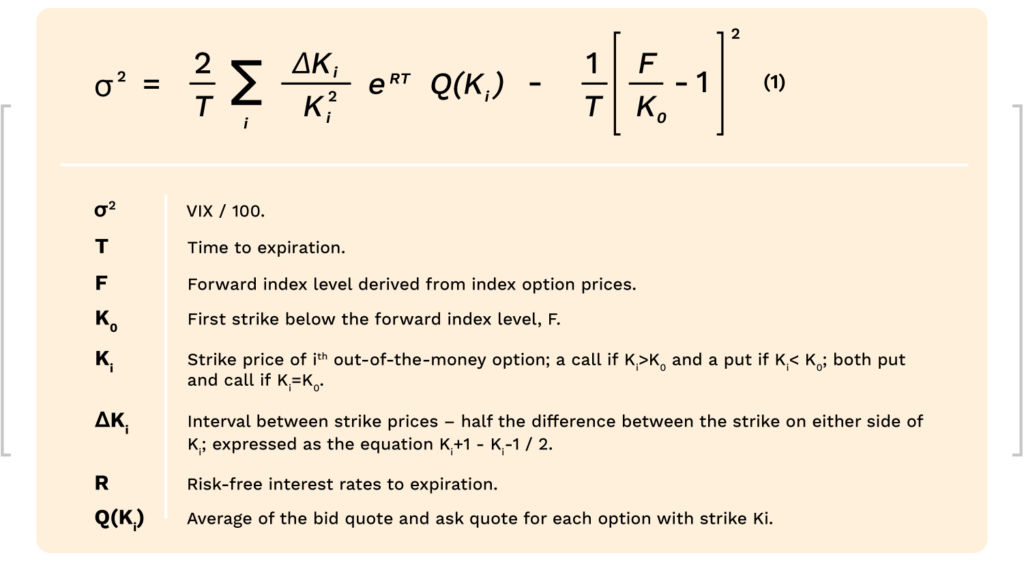
The resulting product is a numerical value, like other stock indices, that investors can use as a buy or sell signal in the expectation volatility will occur in the next 30 days. The VIX value generally ranges between 0 and 100, with lower values indicating low volatility and vice versa.
3 | The VIX is sometimes called the ‘fear index’
If you’ve paid attention to financial media before, you’ve probably heard the VIX referred to as the “Fear Index” or “Fear Gauge.”
That’s because the VIX is largely inversely correlated with the performance of the stock market. When equity indices move down, the VIX typically moves up. When broad stock sell-offs occur, investors’ fear and uncertainty usually increases as well, leading to the branding of the VIX as the Fear Index.
The relationship between fear and volatility works the other way, as well. A low VIX would indicate a rather calm market that benefits from less investor unease, or one that is trending upward.
While the VIX is calculated using both put and call options, it’s put options that really drive the index, as they are weighted more in the formula. When more put options are bought, it’s a general sign that the market is seeking insurance against future declines in the market. Thus, when investors fear near-term or sustained volatility, they seek out put options, consequently driving up the VIX.
True to form, the VIX has reached its highest levels during periods of the most intense market fear, including Black Monday of 1987, the Great Recession of 2008-09 and the COVID-19 pandemic of early 2020.
4 | You can trade the VIX
While investors cannot hold the VIX like they would the S&P 500 or Nasdaq-100 through an index-tracking exchange-traded fund (ETF), there are still financial products for trading the index.
In 2004, Cboe launched VIX futures contracts, which are exclusively traded on the Cboe Futures Exchange (CFE). Futures reflect the estimated value of the VIX on various expiration dates. Two years later in 2006, Cboe introduced VIX options, which have monthly and weekly expiration dates and are traded on Cboe Options. Combined trading activity for both grew to nearly 800,000 contracts per day in 2015.
The products were designed to help give investors an opportunity for gaining exposure to pure volatility. Sound a bit counterintuitive? In reality, it would make sense for some portfolios and investing strategies to feature VIX futures and options. According to Cboe, the negative correlation between volatility and stock market performance would suggest that there are potential portfolio diversification and risk management advantages from trading VIX futures and options — even for individual investors.
5 | Reading the VIX can be complicated
Before you start trading VIX futures or options, or use the VIX value to inform other investment decisions, it’s important to note that reading and interpreting the VIX isn’t always straightforward.
As mentioned, the VIX is expressed along a range of 0 to 100 basis points. After its major update in 2003, the index’s moving 30-day average reached between 10 and 20 — until 2007, when it started to tick up into the 20s and 30s. By the time the financial crisis hit, the VIX hit an intraday record of more than 89 in mid-October 2008.
However, a high VIX index does not automatically mean stocks are bearish. Instead, the high VIX value is merely a representation of the fact that the market expects a sharp trend in momentum, either upward or downward.
There is also a misconception that the VIX value is a one-for-one estimation of the percentage change expected in the S&P 500. For example, if the VIX closes at 18 on any given day, this logic would hold that the index would rise or fall 18% in the 30 days from close.
Another wrinkle to reading the VIX is that intraday spot values are calculated differently than end settlement values. While the differences in the formulas are another can of worms, it basically means there may be discrepancies.
6 | The VIX has set big records
While intraday highs are highly watched, it’s the VIX final daily value that is judged to be the most accurate representation of implied volatility.
In terms of record VIX highs, most are bunched up in periods of the greatest market volatility, such as the Great Recession or COVID-19 pandemic. The highest VIX daily closings are:
- 82.69 on Monday, March 16, 2020.
- 80.86 on Thursday, Nov. 20, 2008.
- 80.06 on Monday, Oct. 27, 2008.
- 79.13 on Friday, Oct. 24, 2008.
- 76.45 on Wednesday, March 18, 2020.
However, the Black Monday crash of 1987 blows those numbers away — but with a caveat. Remember, the VIX was updated to its current formula in the early ’90s. However the VXO index was still around, for which CBOE provides historical data. On Monday, October 19, 1987, the previous fear index closed at 150.19.
Looking at close-to-close — as in the difference between closings from one day to the next — helps illustrate how quickly markets can turn. For instance:
- The VIX jumped nearly 25 points (from 57.83 to 82.69) between close on Friday, March 13, 2020 to close on Monday, March 16, 2020.
- Black Monday closed at more than 113 points higher than the Friday before.
Evidently, Monday can be a particularly rocky trading day as markets come back from the weekend and digest news and developments.
7 | The VIX has siblings
The VIX isn’t the only measure of volatility that Cboe calculates. While the VIX is broadly applicable across the larger stock market, it may not best represent volatility in certain sectors or time frames. For that, Cboe has a suite of other volatility indices, including:
- ShortTerm Volatility Index (VIX9DSM), which reflects nine-day expected volatility of the S&P 500 Index.
- S&P 500 1-Year Volatility Index (VIX1YSM).
- Nasdaq-100 Volatility Index (VXNSM).
- Dow Jones Industrial Average Volatility Index (VXDSM).
- Russell 2000 Volatility Index (RVXSM).
Learn how Magma Capital Funds utilizes the VIX
The VIX plays a major role in how Magma Capital Funds allocates investments. When certain VIX values are reached, it kicks into motion a dynamic reallocation of the fund so that it can manage the risk of future expected volatility and find returns in the most opportune asset classes.
Yet the VIX is only one of the volatility measures the fund monitors. There are other signals that help direct and guide us so that allocations are optimized amid turbulent markets.
Want to learn more about the Magma Capital Funds or how to invest? Contact us today with any questions.